How Historical Data Shapes Funding Decisions
Analyze historical funding patterns and time-series metrics to prioritize deeptech investments, manage risk, and spot underfunded research areas.
How Historical Data Shapes Funding Decisions
Why It Matters:
- Past Trends Inform Future Moves: Analyzing historical funding patterns reveals which technologies, teams, and sectors deliver returns.
- Sector-Specific Insights: For example, advanced materials or quantum technologies often need longer timelines before profitability.
- Metrics That Matter: Track capital efficiency (e.g., patents filed per dollar invested) and sector growth rates to prioritize investments.
Key Tools and Sources:
- SBIR.gov: Tracks government awards by sector, dating back to 1983.
- Crunchbase & PitchBook: Private databases offering insights into deal sizes, investor networks, and exit trends.
- Innovation Lens: Combines historical data with predictive analytics to identify underfunded research areas.
Actionable Insights:
- Use time series analysis to spot growth trends by sector.
- Segment funding data by stage (e.g., early-stage grants vs. late-stage private equity).
- Combine historical data with real-time analytics for dynamic decision-making.
This approach shifts funding from guesswork to a data-backed strategy, helping funders target high-potential opportunities while managing risks effectively.
How Do We Use Historical Time-Series Data?
Where to Find Historical Funding Data and What It Reveals
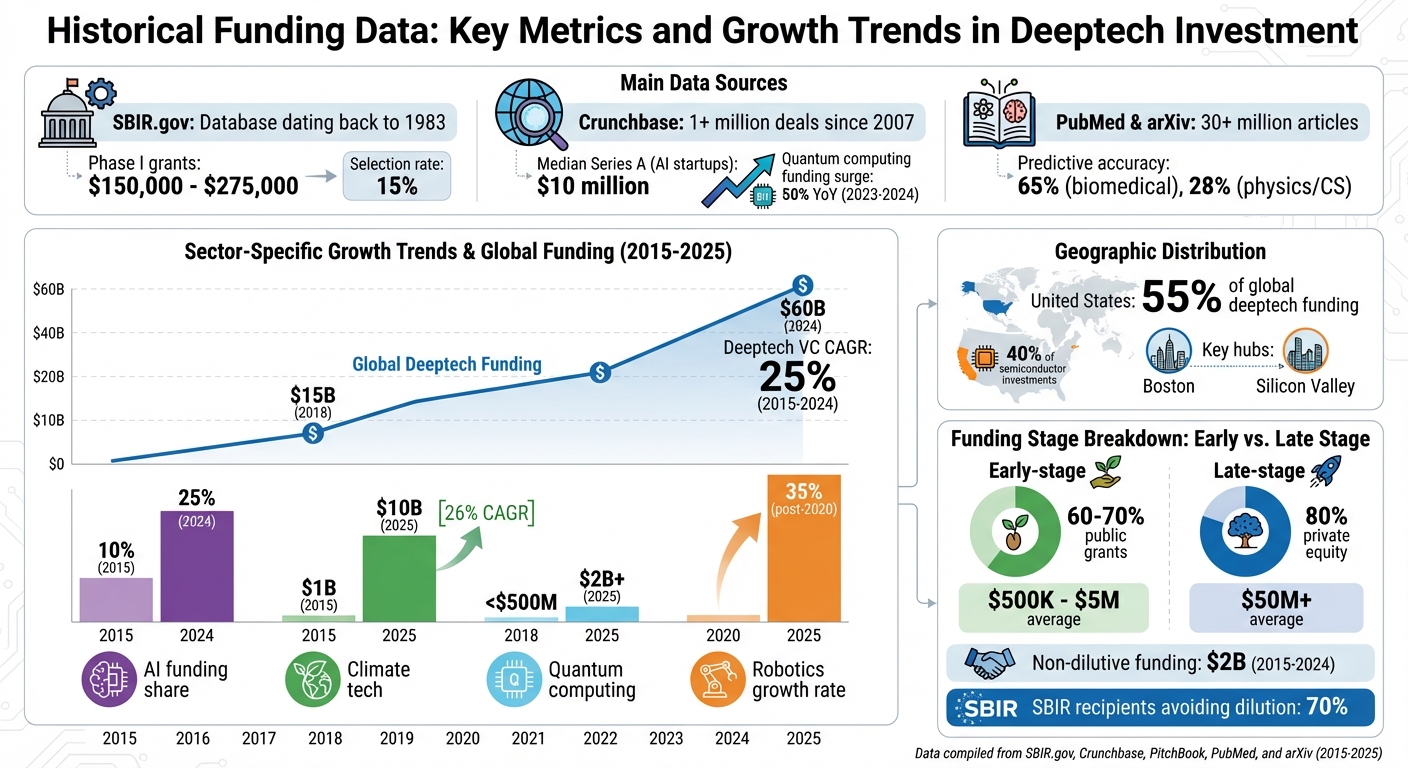
Historical Funding Data: Key Metrics and Growth Trends in Deeptech Investment
Main Sources of Historical Funding Data
Government programs are a treasure trove of historical funding records. The Small Business Innovation Research (SBIR) program, run by agencies like the NSF, DoD, and NIH, has maintained a searchable database of awards dating back to 1983. Recent figures show that Phase I grants typically range between $150,000 and $275,000, with a selection rate of about 15%. The SBIR.gov database also categorizes awards by sectors such as AI, biotech, and quantum computing, while tracking recipient outcomes[2]. Beyond government archives, private databases provide even deeper insights into historical funding trends.
Private platforms like Crunchbase compile data from over 1 million deals since 2007, covering everything from round sizes to investor networks and exit events. For instance, median Series A funding for AI startups hovers around $10 million. Crunchbase data also highlights trends like a 50% year-over-year surge in quantum computing funding between 2023 and 2024, helping investors identify key hubs like Boston and Silicon Valley[2][5]. Similarly, services like PitchBook and CB Insights publish annual reports showing that global deeptech venture capital surpassed $50 billion from 2015 to 2024, with detailed breakdowns by subsector and metrics such as 3x median multiples for exits[4].
Scientific repositories like PubMed and arXiv offer a different lens by tracking the evolution of research areas through over 30 million articles. Tools like Innovation Lens tap into these databases to locate underexplored fields. Predictive models used on these platforms have shown accuracy improvements of 65% for PubMed topics and 28% for research in Physics and Computer Science, helping funders pinpoint promising areas before they become saturated[1]. With these data sources in hand, analyzing key metrics can uncover where capital is flowing and where opportunities are emerging.
Which Metrics to Track in Historical Data
Tracking sector-specific funding patterns is essential to understanding where investment is concentrated. For instance, Crunchbase data reveals that AI's share of deeptech venture capital rose from 10% in 2015 to 25% in 2024. Geographic trends are equally telling, with California accounting for 40% of semiconductor investments[2][6]. Keeping an eye on these trends allows for smarter allocation of funds and better risk management.
Metrics like total capital raised and growth rates provide a broader view of market dynamics. Global deeptech funding climbed from $15 billion in 2018 to $60 billion in 2024, with the United States securing 55% of that total. Within this, climate tech alone attracted $12 billion in 2023. Deeptech venture capital saw a 25% compound annual growth rate from 2015 to 2024, while robotics funding surged with a 35% growth rate after 2020[5][8].
Another critical metric is non-dilutive funding trends. Data from NSF Award Search and ARPA-E indicates that deeptech grants totaled $2 billion between 2015 and 2024, with cleantech grants growing at an annual rate of 20%. Notably, 70% of SBIR recipients initially avoid equity dilution, suggesting that combining grants with venture capital could help founders retain more ownership of their companies[2][4].
How to Extract Trends and Patterns from Historical Data
Growth Trends by Sector
Time series analysis is a powerful tool to uncover multi-year funding trends. By applying a 5-year moving average, you can smooth out the noise of short-term fluctuations and focus on the bigger picture. For instance, analyzing AI funding data between 2015 and 2025 reveals a compound annual growth rate (CAGR) of over 25%. This growth noticeably accelerated after 2020, a period when advancements in machine learning began drawing significant institutional investments[2][3][6].
Quantum computing displays an even steeper trajectory. Investments in this sector grew from under $500 million in 2018 to over $2 billion by 2025, largely driven by advancements in qubit stability and error correction technologies. Similarly, climate tech saw its funding triple after 2020, fueled by a mix of policy initiatives and corporate commitments to sustainability[2][3].
Visual tools like line charts make it easier to compare year-over-year changes at a glance. Calculating growth rates using the formula (End/Start)^(1/n) - 1 offers deeper insights. For example, climate tech funding grew from $1 billion in 2015 to $10 billion in 2025, translating to a 26% CAGR. This kind of data provides clear signals for prioritizing resources[2][6].
Platforms like Innovation Lens take this analysis further by processing over 30 million articles from sources like PubMed and arXiv. They can predict funding opportunities with 65% greater accuracy in biomedical fields and a 28% improvement in physics and computer science topics - highlighting where research momentum aligns with investment potential[1].
Once sector growth trends are clear, the next step is to examine how funding patterns shift across different stages of a project’s lifecycle.
Funding Stage Patterns: Early vs. Late-Stage Investments
Understanding shifts in funding stages can refine the timing of investments. Historical data shows that early-stage deeptech projects typically rely on public grants for 60–70% of their funding, while late-stage rounds secure 80% of their capital from private equity[2][3][5]. Metrics like average round size and deal counts can help pinpoint these transitions. Early-stage funding often ranges between $500,000 and $5 million, sourced through programs like SBIR awards and NSF grants. In contrast, late-stage funding exceeds $50 million as companies demonstrate scalability[2][3][5].
Take PsiQuantum as an example. The quantum computing startup received $18 million in U.S. government grants starting in 2015 to support its foundational R&D. By 2021, after proving the viability of its prototypes, the company attracted $450 million in private investment rounds[3][4]. Similarly, Commonwealth Fusion Systems secured $55 million in Department of Energy grants in 2018 for fusion energy research. By 2021, it raised $1.8 billion from private investors, thanks to achieving key technical milestones that demonstrated its commercial potential[3][4].
To uncover similar patterns in your own data, segment funding by stage to analyze the mix of public versus private capital. Cohort analysis - grouping projects by their start year - can also reveal shifts in funding dynamics. For example, data from 2015 cohorts shows that 65% of early funding came from grants, whereas 2020 cohorts relied on grants for only 20% of their early funding. This shift suggests that maturing deeptech sectors are now attracting private capital earlier in their development cycle[3][6][7].
sbb-itb-5766a5d
Using Historical Data to Forecast Success and Improve Funding
What Predicts Success in Deeptech Funding
Looking at historical funding trends gives us a solid understanding of what sets successful deeptech projects apart from those that struggle. One standout factor is early technical validation. Projects that demonstrate reproducible proof-of-concept results, strong prototype performance, and independent lab validation are more likely to secure follow-on funding and hit their commercial milestones. Scoring early technical validation on a 1–5 scale can help predict both funding success and overall commercial viability.
Another key factor is government co-funding. Competitive U.S. grants ranging from $500,000 to $5,000,000 often provide the resources needed to extend technical development, reduce intellectual property risks, and increase the chances of pilot success. When you pair grant data with indicators like pilot contracts and unit economics, you get a clearer view of a project's potential.
Capital efficiency also plays a major role. This measures how effectively a project uses its funding to achieve milestones like patents, pilots, and publications. Projects that achieve more milestones with fewer dollars tend to attract additional funding. Additionally, examining historical failure patterns offers valuable lessons. Data shows that most lab-to-pilot hardware failures occur between seed funding and Series A. Using hazard curves can help investors decide whether to continue funding or cut losses at the right time.
These indicators, when aligned with broader funding trends, create a reliable framework for evaluating deeptech opportunities. They reinforce the importance of capital efficiency and provide actionable insights for assessing potential investments.
Finding Underserved and High-Potential Research Areas
Building on these success metrics, identifying areas of untapped potential is crucial for shaping future funding strategies. It’s not just about doubling down on proven sectors - it’s about finding where scientific progress is outpacing funding. By calculating funding intensity (total investment and project count over a 5–10 year period) and outcome intensity (exits, pilots, and intellectual property), you can pinpoint underfunded yet promising subfields. Subfields with strong technical output but limited funding and company formation are often ripe for investment.
Tools like Innovation Lens take this a step further. By analyzing global publication data, patent filings, grant databases, and private funding rounds, the platform maps emerging scientific clusters. It processes over 30 million articles from sources like PubMed and arXiv to identify areas where citation velocity and interdisciplinary activity are growing faster than capital investment. Predictive models estimate whether a field is likely to generate commercially viable intellectual property or venture-scale companies within 7–12 years. These models boast 4x higher accuracy in biomedical fields and 2x in physics and computer science[1].
How to Apply Historical Data to Your Funding Strategy
Combining Historical Data with Real-Time Analytics
Historical data becomes far more actionable when paired with real-time analytics. Start by establishing baseline metrics like average deal sizes, time-to-commercialization, and success rates. Then, layer in real-time indicators such as recent patent filings, publication trends, and current funding activity. This mix helps you detect when actual developments deviate from historical norms, revealing new opportunities or potential risks.
Take Innovation Lens as an example. This platform processes over 30 million articles from PubMed and arXiv, updating its dataset weekly to pinpoint research areas where current activity outpaces historical trends. One standout feature is its ability to generate "future abstracts" - predicted research topics that are statistically likely to emerge within 24 months. By leveraging this kind of data, Innovation Lens reliably identifies impactful, emerging fields [1].
To put this into practice, create a workflow that includes data collection and cleaning, trend modeling, real-time data integration, and deviation flagging. For instance, if historical data shows that quantum computing deals averaged $10 million over five years, but recent rounds are trending at $7 million, it might be time to shift resources. You could explore earlier-stage investments or adjacent fields with stronger momentum. This integrated approach allows for dynamic adjustments to your funding strategy.
Adjusting Funding Models Over Time
Relying on fixed annual funding plans can leave you lagging in a fast-moving sector like deeptech. Instead, consider implementing quarterly review cycles to compare real-world outcomes against your historical benchmarks. Track key metrics like follow-on funding rates, milestone completion timelines, and capital efficiency across your portfolio. When you notice shifts - such as extended development cycles or changes in co-investor behavior - adjust your funding models accordingly.
Historical data on failure rates can also guide your strategy. For example, if certain project types tend to fail more often in the early stages, closely monitor burn rates and technical milestones during those critical periods. Additionally, when broader conditions change - like interest rate adjustments, regulatory shifts, or sector downturns - run simulations based on past crises to stress-test your strategy. Research from the CFA Institute supports this approach, advocating for a mix of algorithm-driven insights and expert judgment. Algorithms can help prioritize, but domain experts are essential for interpreting edge cases and qualitative nuances [3]. By staying flexible and responsive to both data and market dynamics, you can keep your funding strategy aligned with evolving realities.
Conclusion
Historical funding data serves as a guide to make smarter decisions in deeptech investments. By analyzing metrics such as funding amounts, success rates, and sector growth trends, you can identify where past investments have yielded strong returns and uncover areas that remain underfunded. This approach shifts decision-making from guesswork to strategy, helping you predict which research areas are statistically more likely to deliver results within a 24-month timeframe.
Taking it a step further, blending historical data with real-time analytics sharpens this process even more. For example, platforms like Innovation Lens leverage over 30 million articles from PubMed and arXiv to pinpoint high-impact research areas with remarkable precision [1]. This method not only helps steer clear of oversaturated sectors but also highlights untapped "white spaces" where innovation potential is high and competition is low. By combining these data-driven insights, investors are better equipped to anticipate the next wave of advancements.
The takeaway is clear: properly cleaned, segmented, and continuously updated historical data reduces risk and strengthens strategic decision-making, making it a universal tool for navigating the ever-evolving deeptech landscape.
FAQs
How does historical data guide funding decisions in deeptech?
Historical data is essential when it comes to making smart funding decisions in the deeptech sector. It helps highlight trends, pinpoint new opportunities, and reduce potential risks. By examining past funding patterns and their outcomes, investors and grantmakers can strategically direct resources toward promising but lesser-explored areas of research.
With tools like predictive analytics and curated insights, decision-makers can zero in on projects with a higher chance of success. This approach ensures that funding is channeled effectively to back transformative advancements and future scientific achievements.
What metrics should you focus on when reviewing historical funding data?
When diving into historical funding data, several key areas deserve attention:
- Shifts in funding over time: Examine how funding levels have evolved to uncover trends or major changes.
- Funding sources: Identify which organizations or industries are providing funds and the scale of their contributions.
- Impact of funded projects: Assess the success of projects by looking at measurable outcomes, such as citations or tangible results.
- Allocation of funds: Review how funding is distributed among different research fields to highlight areas that might need more support.
- Timeline to results: Study the typical duration from funding to meaningful outcomes to understand the efficiency of investments.
By focusing on these areas, it's possible to make smarter funding decisions and zero in on research with the greatest potential for future success.
How can historical data and real-time analytics improve funding decisions?
Merging historical data with real-time analytics creates a compelling tool for making smarter funding decisions. By examining past trends together with current developments, stakeholders can better understand which research areas hold the greatest promise for groundbreaking outcomes.
This method shines a light on underfunded projects with high potential, ensuring resources are distributed more effectively. It also allows organizations to pivot quickly when new scientific advancements arise, boosting the likelihood of backing transformative innovations in deeptech.