How Co-Citation Maps Reveal Research Gaps
Visualize co-citation networks to find isolated clusters, bridging papers, and emerging trends—tools and best practices for spotting research gaps.

How Co-Citation Maps Reveal Research Gaps
Co-citation maps are powerful tools that help researchers identify connections, gaps, and trends in academic literature. By analyzing how often papers are cited together, these maps highlight relationships and patterns that might otherwise go unnoticed. Here's what you need to know:
- What They Do: Co-citation maps visualize how academic papers are linked through shared citations, revealing clusters of related research and isolated areas ("knowledge silos").
- Why They Matter: They help pinpoint underexplored areas, bridge disconnected research fields, and guide decision-making for researchers, investors, and institutions.
- How They're Made: Using tools like VOSviewer, researchers analyze citation data from databases (e.g., Web of Science) to create networks, group similar studies, and identify gaps.
- Real-World Use: From mapping trends in AI to assessing the impact of biomedical research, co-citation maps are used to detect research gaps and improve collaboration.
Co-citation analysis is a data-driven way to navigate the growing volume of scientific literature, offering insights into where research is thriving - and where it's falling short. Below, we’ll break down how these maps are built, the patterns they reveal, and real-world examples of their impact.
How Co-Citation Maps Are Built
Data Sources and Selection Criteria
The foundation of building co-citation maps starts with choosing a reliable bibliographic database. Researchers often rely on platforms like the Web of Science Core Collection, Scopus, or the NIH Open Citations Collection to access peer-reviewed studies [1]. Among these, the Web of Science Core Collection is a popular choice because its consistent reference formatting simplifies data processing. However, the choice of database can influence the results, as it tends to favor high-impact literature. Caleb M. Trujillo from Michigan State University's Department of Plant Biology highlighted this issue:
The results are limited by the source database... curators tend to bias the inclusion of high-impact literature rather than a large breadth of literature [1].
Once the database is selected, researchers define the scope of their study using targeted search queries, often focusing on keywords in titles or abstracts. For instance, a study on "systems thinking" might use this phrase to establish clear boundaries for the research area [1]. The process involves applying citation thresholds, or "trim levels", to include only documents co-cited a minimum number of times - commonly three or five [1][4]. In one example, a systems thinking study extracted 20,032 unique cited documents from 542 source articles, with 94% of the documents published after 1990 and 41% between 2010 and 2015 [1]. Additional filters, such as publication dates, journal names, and manual adjustments for author name inconsistencies, further refine the dataset [4].
Building and Normalizing the Network
After gathering the data, researchers identify co-citation relationships by locating document pairs that frequently appear together in reference lists. Each pair forms an "edge" in the network, and the frequency of their co-citation determines the strength of their connection [1]. Stronger connections bring nodes closer together in the network visualization.
To focus on meaningful patterns, researchers remove weaker connections - document pairs co-cited fewer than three times, for example - thereby reducing noise in the network [1]. Adjusting the trim level significantly impacts the network's structure. In one study, a threshold of three co-citations resulted in a network with 246 nodes and 1,292 edges, achieving an internal consistency of 0.56. Raising the threshold to five co-citations reduced the network to 71 nodes and 271 edges but improved consistency to 0.74 [1]. Once the network is refined, researchers proceed to group the documents into thematic clusters.
Clustering and Identifying Communities
With a normalized network, clustering algorithms are used to group related documents into thematic communities. Tools like VOSviewer, which include algorithms such as Smart Local Moving (SLM), automatically detect clusters that represent specific research areas or methodologies [1]. For example, in January 2018, Trujillo and Long from Michigan State University analyzed 229 source articles on systems thinking using the SLM algorithm. They identified seven major clusters, including one focused on science and engineering education, which was notably isolated from broader systems theory research [1].
Metrics such as betweenness centrality are also calculated to identify "bridging" documents - papers that connect distinct scholarly communities and promote interdisciplinary collaboration [1]. Cecile Janssens, a Research Professor of Epidemiology at Emory University, explained:
Citations connect articles on the same topic... This similarity is not based on the opinion of one researcher, but on the citation behavior of the entire field [5].
How to interpret co-citation analysis in Vosviewer? [Detailed Bibliometrics - co-citations networks]
Patterns That Reveal Research Gaps
Co-Citation Map Patterns and Research Gap Indicators
Isolated Clusters and Weak Connections
Co-citation maps often expose isolated clusters, or "knowledge silos", which suggest minimal interaction or integration across disciplines. These silos highlight areas where ideas fail to circulate within the broader scientific community [2].
Weak connections between clusters further emphasize gaps where topics overlap in content but lack strong citation links. For instance, in August 2025, researchers E. Cunningham and D. Greene analyzed a citation network of 20,604 papers in the eXplainable AI (XAI) field. They discovered that certain application domains operated as isolated silos, with little knowledge transfer from foundational research in psychology and statistics [2]. As they observed:
Significant "knowledge gaps" are identified between related XAI research areas, suggesting opportunities for cross-pollination and improved knowledge integration [2].
Fragmentation, where small clusters are weakly connected, further signals niche areas at risk of isolation. A notable example comes from Trujillo and Long's January 2018 study of systems thinking literature. They found that education-focused research formed a distinct, weakly connected community, largely separated from foundational systems theory [1]. Similarly, an analysis of 65,290 PNAS articles revealed that data-driven partitions achieved 48% higher modularity than traditional disciplinary classifications, showing how research clusters often transcend conventional boundaries [7].
These patterns naturally lead to the question of how bridging nodes can connect fragmented research.
Bridging Nodes and Structural Holes
Certain papers with high betweenness centrality act as critical bridges, linking otherwise disconnected research areas. These "bridging nodes" play a key role in transferring knowledge and opening up pathways for integration that might otherwise remain unnoticed [3, 13]. By combining strong local clustering within specialties with efficient connections to distant areas, these nodes create opportunities for innovation and knowledge sharing [7].
On the other hand, structural holes - the gaps between unconnected clusters - highlight prime opportunities for collaboration across disciplines. Identifying papers with high betweenness centrality can pinpoint where these gaps exist and reveal avenues for unifying disparate fields [3, 13]. This complements the earlier observation of isolated clusters by offering practical ways to encourage interdisciplinary integration.
For organizations such as deeptech investors and grantmakers, these bridging opportunities represent key areas for strategic funding. By connecting previously separate research domains, they can potentially spark major breakthroughs. Platforms like Innovation Lens (https://innovationlens.org) use predictive analytics and curated reports to help identify these high-potential integration points.
Emerging Trends and Temporal Shifts
Static structural patterns are just one part of the picture. Examining how citation trends change over time reveals evolving research priorities and emerging niches. Tracking "citation bursts" - sudden spikes in a paper's citations - can indicate intense focus on a developing trend [16, 17].
For example, a study of 33,045 papers from 24 top business journals (1991–2018) showed how dominant research clusters shifted over time. By 2018, "social media" had emerged as the largest cluster, with 127 references and a mean publication year of 2009, effectively replacing earlier topics like "strategic alliance" from the 1990s [10]. As Fangfang Wei and Guijie Zhang explained:
A citation burst indicates that the research community has paid an intensive degree of attention to the underlying work [10].
Dynamic community detection also helps track when research communities form, fade, or merge [2]. For instance, an analysis of PNAS articles (2000–2017) found that "small-world propensity" in topic networks increased over time (R² = 0.25, p = 0.01), suggesting growing intellectual integration [7]. Monitoring nodes with high betweenness centrality in current maps could even help anticipate future shifts or integration opportunities [9].
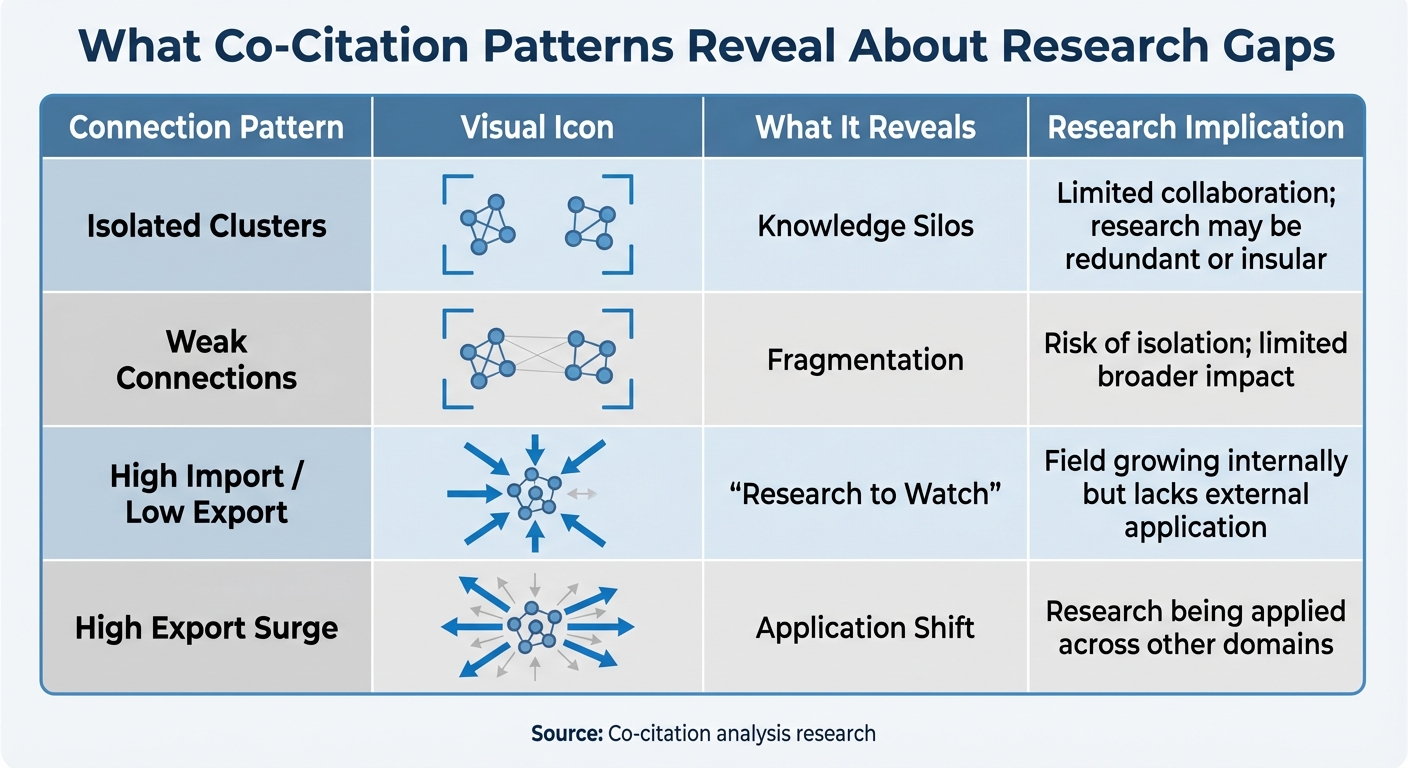
| Connection Pattern | What It Reveals | Research Implication |
|---|---|---|
| Isolated Clusters | Knowledge Silos | Limited collaboration; research may be redundant or insular [2] |
| Weak Connections | Fragmentation | Risk of isolation; limited broader impact [1] |
| High Import / Low Export | "Research to Watch" | Field growing internally but lacks external application [8] |
| High Export Surge | Application Shift | Research being applied across other domains [8] |
sbb-itb-5766a5d
Case Studies: Co-Citation Maps in Action
Transdisciplinary Mapping with Co-Citation Analysis
Back in January 2018, Caleb M. Trujillo and Tammy M. Long from Michigan State University conducted an analysis of 229 source articles focused on "systems thinking." Their findings revealed something striking: a distinct education cluster that was disconnected from the foundational systems theory rooted in business and management [1]. As Trujillo explained:
Document co-citation analysis (DCA) is a method that may be useful for avoiding isolation in scholarship, expediting knowledge integration, and, ultimately, building consilience across disciplines [1].
This highlights how DCA can uncover pivotal literature outside a researcher’s immediate field, paving the way for cross-disciplinary integration. By identifying critical, "must-read" documents from other areas, DCA creates practical opportunities for collaboration across disciplines.
<a href="https://auraplusplus.com/projects/innovation-lens-predictive-research-mapping" target="_blank" rel="noopener">
<img src="https://auraplusplus.com/images/badges/featured-on-light.svg" alt="Featured on Aura++" width="265" height="58" />
</a>
Domain-Specific Gap Detection
Co-citation maps don't just facilitate integration - they also pinpoint gaps in specific research areas, offering actionable insights for prioritizing investment.
Take, for example, the work of Eoghan Cunningham and Derek Greene from the Insight SFI Research Centre for Data Analytics. In August 2025, they analyzed 20,604 papers in the eXplainable Artificial Intelligence (XAI) field. Their dynamic analysis revealed a major disconnect: foundational studies in psychology and statistics were largely absent from modern XAI applications. By quantifying knowledge transfer probabilities and mapping content similarities, they uncovered isolated "knowledge silos" within the field [2].
In another study, Anoop Manjunath, Ishan Kumar, and James Zou from Stanford University School of Medicine explored the biomedical sector in June 2021. They examined 2.4 million patent-to-research citations, creating a detailed map that linked patents to PubMed publications. This effort provided a way to measure the "translational productivity" of U.S. research institutions - essentially assessing how effectively academic research is turned into patented innovations. This map became a key tool for identifying gaps between basic science and its real-world applications [11].
These examples demonstrate how co-citation maps can highlight research gaps and guide decisions on where to allocate resources for maximum impact.
Research Investment Insights
Mapping techniques like these are proving invaluable for deeptech investors seeking to identify promising integration opportunities. Platforms such as Innovation Lens are using similar methods to validate high-potential areas for investment.
Patent-citation maps, in particular, have emerged as powerful tools for funding decisions. For example, the biomedical innovation map created by the Stanford team in 2021 provided precise metrics for evaluating the translational impact of research institutions. Unlike traditional metrics like the h-index, these maps offered a clearer picture of which institutions successfully bridge the gap between fundamental research and industrial application. This data has helped funding bodies justify and direct resources toward research with measurable real-world outcomes [11].
For investors and grantmakers, these insights are a game-changer. Tools like Innovation Lens (https://innovationlens.org) use predictive analytics and curated reports based on co-citation patterns to spotlight underexplored research areas with high potential. By aligning investment strategies with data-driven mapping, these platforms help channel resources into projects capable of driving significant progress across disciplines.
Challenges and Best Practices
Data Coverage and Bias
The effectiveness of co-citation analysis hinges on the quality and scope of the source database. Platforms like Web of Science and Scopus often prioritize high-impact journals, which can leave niche or emerging research areas underrepresented. On top of that, using the wrong keywords can further distort the data. For example, Trujillo's 2018 study on systems thinking literature revealed that only 46% of co-cited documents overlapped between a broad search and a more focused one [1]. This highlights how keyword choices can significantly alter the perceived gaps in research. To address this, using multiple databases and employing forward and backward citation tracking can help create a more comprehensive dataset [12][13]. Additionally, developing strong validation methods is key to overcoming these data coverage issues.
Validation and Interpretation
Given the challenges with data coverage, rigorous validation is essential to ensure co-citation maps accurately reflect research dynamics. While co-citation maps may appear compelling, they are often not validated, which can lead to misleading conclusions. Visual clusters, for instance, might represent citation habits rather than true intellectual connections, underscoring the need for thorough validation [1]. Trujillo and Long tackled this issue by employing a three-step validation process: they tested internal consistency using Spearman's rank correlation (achieving ρ = 0.56), verified community validity with WorldCat subject labels (covering 95% of their documents), and assessed stability by comparing results across different search strategies [1].
Another common issue is misinterpreting the connections revealed by co-citation patterns. While these patterns show that documents are cited together, they don’t explain why. For instance, a paper might be cited negatively or simply out of habit, which can distort the actual strength of the relationship [1]. To address this, pairing quantitative co-citation maps with qualitative thematic analysis can help uncover the real story behind the numbers.
Integration with Other Methods
To tackle the limitations of co-citation analysis, combining it with other methods can provide a more robust evaluation of research. For example, Kevin W. Boyack and Richard Klavans demonstrated that while both co-citation and bibliographic coupling successfully clustered over 92% of a dataset containing 2.15 million biomedical articles, a hybrid approach that integrated citation data with textual analysis delivered even better results [14]. As they noted:
The hybrid approach improves upon the bibliographic coupling results in all respects [14].
The strength of bibliographic coupling lies in its focus on current research trends, while co-citation analysis looks backward to reveal the intellectual foundations of a field [14]. By merging these methods, researchers can more effectively identify underexplored areas. Adding keyword co-occurrence analysis into the mix provides an even clearer picture of both the historical trajectory and future directions of a field [6][12]. For those using Innovation Lens, this multi-method strategy offers more dependable insights into which underexplored areas might hold the most promise for investment or funding.
Conclusion
Key Insights and Applications
Throughout this article, we’ve explored how co-citation maps can shine a light on overlooked research gaps while steering strategic research decisions. These maps provide a data-driven approach that traditional literature reviews often fail to achieve. By identifying knowledge silos - those isolated research areas with little to no cross-pollination of ideas - co-citation maps help pinpoint where fields risk becoming fragmented. For example, case studies have shown how education-focused research sometimes drifts away from foundational theories, raising concerns about the disconnect within disciplines.
Co-citation analysis goes a step further by highlighting areas where interdisciplinary collaboration is essential. It uncovers structural gaps in knowledge transfer, where the exchange of ideas is far below what content similarities suggest should occur. For research institutions and grantmakers, this translates into smarter prioritization. Network metrics can spotlight key documents that bridge divides between previously disconnected communities, helping researchers and decision-makers expand their reading lists beyond their core fields [1]. Tools like Innovation Lens use these mapping techniques to guide deeptech investors and research organizations toward underexplored areas with the potential for transformative advancements.
These insights are just the beginning, as emerging methods promise even greater precision in understanding research ecosystems.
Future Directions
The future of co-citation analysis lies in moving beyond static representations to dynamic community detection - tracking how research areas grow, decline, merge, or split over time. Combining these evolving network methods with advanced language models could pave the way for better trend forecasting. By integrating Natural Language Processing tools, such as transformer-based models like SciBERT, researchers will be able to validate the thematic consistency of clusters and bridge the divide between citation-based and content-based analyses [2][3]. These advancements will enhance platforms’ ability to provide actionable insights, empowering research managers and investors to make better-informed decisions about resource allocation and focus on areas with the highest potential for meaningful impact.
FAQs
How do co-citation maps help uncover research gaps?
Co-citation maps are a fascinating way to visualize the connections between research papers. They highlight how often different papers are cited together, forming clusters that represent closely related topics. At the same time, areas with fewer connections can signal underexplored or isolated subjects. By studying these patterns, researchers can uncover "white space" - those unanswered questions, emerging cross-disciplinary possibilities, or overlooked methods waiting to be explored.
With the help of advanced bibliometric tools and platforms like Innovation Lens, this process becomes even more insightful. These tools offer curated insights and predictive analytics, making it easier to spot areas where scholarly discussions are thin. This allows researchers to zero in on promising opportunities for impactful work.
What are the challenges of using co-citation maps to analyze research gaps?
Co-citation maps are a powerful tool for uncovering relationships between scholarly works, but they come with a few hurdles. One key aspect to watch out for is the distinction between the symmetric co-citation matrix - which tracks how often two documents are cited together - and the asymmetric citation matrix, which focuses on who cites whom. Mixing these up during similarity calculations can lead to misleading outcomes.
Another challenge lies in selecting the right similarity metric. Using an unsuitable metric can skew the perceived connections between works, making it harder to pinpoint genuine intellectual relationships. On top of that, the quality of citation data plays a big role. Data sourced from the web often lacks the consistency and reliability of carefully curated indexes, which can result in missing or inaccurate information.
To make co-citation maps as effective as possible, researchers need to be thoughtful about their methods, choose appropriate metrics, and rely on reliable data sources for the best results.
What makes co-citation maps different from other citation analysis methods?
Co-citation maps are a fascinating way to visualize the connections between research papers. They work by analyzing how often two documents are cited together in later studies, creating a network that highlights relationships and clusters of related work. These clusters often point to areas of intense intellectual activity, like new or evolving research fields, by showing how scholars interpret the connections between different studies.
Unlike other methods, such as direct citation counts - which simply measure how popular a paper is - or bibliographic coupling, which links papers based on shared references at the time they were published, co-citation maps dig deeper. They reveal patterns and gaps in knowledge that might otherwise go unnoticed. This makes them an incredibly useful tool for spotting areas of research with untapped potential, especially in scientific and technological fields.